| Zentrum | Herz | Leber | Lunge | Niere | Pankreas | Stammzellen | Total |
|---|---|---|---|---|---|---|---|
| HD | 50 | 37 | 0 | 660 | 20 | 0 | 767 |
| KUM | 0 | 223 | 2 | 298 | 15 | 0 | 538 |
| MHH | 0 | 100 | 1 | 241 | 0 | 211 | 553 |
| MRI | 0 | 8 | 0 | 349 | 10 | 207 | 574 |
| TUE | 0 | 231 | 0 | 303 | 14 | 40 | 588 |
| Total | 50 | 599 | 3 | 1851 | 59 | 458 | 3020 |

| Probenart | Herz | Leber | Lunge | Niere | Pankreas | Stammzellen | Total |
|---|---|---|---|---|---|---|---|
| Buffy coat | 63 | 4259 | 10 | 14087 | 488 | 2127 | 21034 |
| PBMCs | 0 | 4667 | 4 | 9606 | 372 | 2373 | 17022 |
| Plasma | 265 | 19019 | 42 | 58566 | 2096 | 10318 | 90306 |
| RNA Pax Blut | 39 | 2277 | 6 | 6986 | 248 | 1413 | 10969 |
| Serum | 293 | 15513 | 50 | 48908 | 1676 | 8833 | 75273 |
| Total | 660 | 45735 | 112 | 138153 | 4880 | 25064 | 214604 |

| Probenart | Herz | Leber | Lunge | Niere | Pankreas | Stammzellen | Total |
|---|---|---|---|---|---|---|---|
| Gewebe FFPE | 0 | 3 | 0 | 21 | 1 | 0 | 25 |
| Stuhl | 0 | 477 | 4 | 1230 | 33 | 623 | 2367 |
| Urin | 60 | 8233 | 12 | 42386 | 1374 | 5571 | 57636 |
| Urin-Sediment | 10 | 1869 | 3 | 8443 | 272 | 1260 | 11857 |
| Total | 70 | 10582 | 19 | 52080 | 1680 | 7454 | 71885 |

| Zentrum |
IST Stand Monat 3 |
SOLL Stand Monat 3 |
Performance in % Monat 3 |
IST Stand Monat 6 |
SOLL Stand Monat 6 |
Performance in % Monat 6 |
IST Stand Monat 9 |
SOLL Stand Monat 9 |
Performance in % Monat 9 |
IST Stand Monat 12 |
SOLL Stand Monat 12 |
Performance in % Monat 12 |
IST Stand Monat 24 |
SOLL Stand Monat 24 |
Performance in % Monat 24 |
IST Stand Monat 36 |
SOLL Stand Monat 36 |
Performance in % Monat 36 |
IST Stand Monat 48 |
SOLL Stand Monat 48 |
Performance in % Monat 48 |
IST Stand Monat 60 |
SOLL Stand Monat 60 |
Performance in % Monat 60 |
|---|---|---|---|---|---|---|---|---|---|---|---|---|---|---|---|---|---|---|---|---|---|---|---|---|
| HD | 13 | 14 | 92.86 | 10 | 14 | 71.43 | 8 | 14 | 57.14 | 8 | 14 | 57.14 | 5 | 14 | 35.71 | 2 | 14 | 14.29 | 0 | 14 | 0 | 0 | 13 | 0 |
„3 Monate“:
Ist = Anzahl der Teilnehmer, die nach Verlassen der Klinik und bis (3 + 1,5 =) 4,5 Monate nach Transplantation zum FU erschienen sind;
Soll = Anzahl der Teilnehmer, dessen Transplantation zum jetzigen Zeitpunkt länger als 4,5 Monate zurückliegt
„6 Monate“:
Ist = Anzahl der Teilnehmer, die 4,5 bis (6 + 1,5 =) 7,5 Monate nach Transplantation zum FU erschienen sind;
Soll = Anzahl der Teilnehmer, dessen Transplantation zum jetzigen Zeitpunkt länger als 7,5 Monate zurückliegt
…
„24 Monate“:
Ist = Anzahl der Teilnehmer, die (12 + 1,5 =) 13,5 bis (24 + 1,5 =) 25,5 Monate nach Transplantation zum FU erschienen sind;
Soll = Anzahl der Teilnehmer, dessen Transplantation zum jetzigen Zeitpunkt länger als 25,5 Monate zurückliegt
…
Teilnehmende, die verstorben oder lost-to-follow-up sind, oder das Organ verloren haben, werden ab diesem Zeitpunkt nicht mehr in der Berechnung berücksichtigt.
| Zentrum |
IST Stand Monat 3 |
SOLL Stand Monat 3 |
Performance in % Monat 3 |
IST Stand Monat 6 |
SOLL Stand Monat 6 |
Performance in % Monat 6 |
IST Stand Monat 9 |
SOLL Stand Monat 9 |
Performance in % Monat 9 |
IST Stand Monat 12 |
SOLL Stand Monat 12 |
Performance in % Monat 12 |
IST Stand Monat 24 |
SOLL Stand Monat 24 |
Performance in % Monat 24 |
IST Stand Monat 36 |
SOLL Stand Monat 36 |
Performance in % Monat 36 |
IST Stand Monat 48 |
SOLL Stand Monat 48 |
Performance in % Monat 48 |
IST Stand Monat 60 |
SOLL Stand Monat 60 |
Performance in % Monat 60 |
|---|---|---|---|---|---|---|---|---|---|---|---|---|---|---|---|---|---|---|---|---|---|---|---|---|
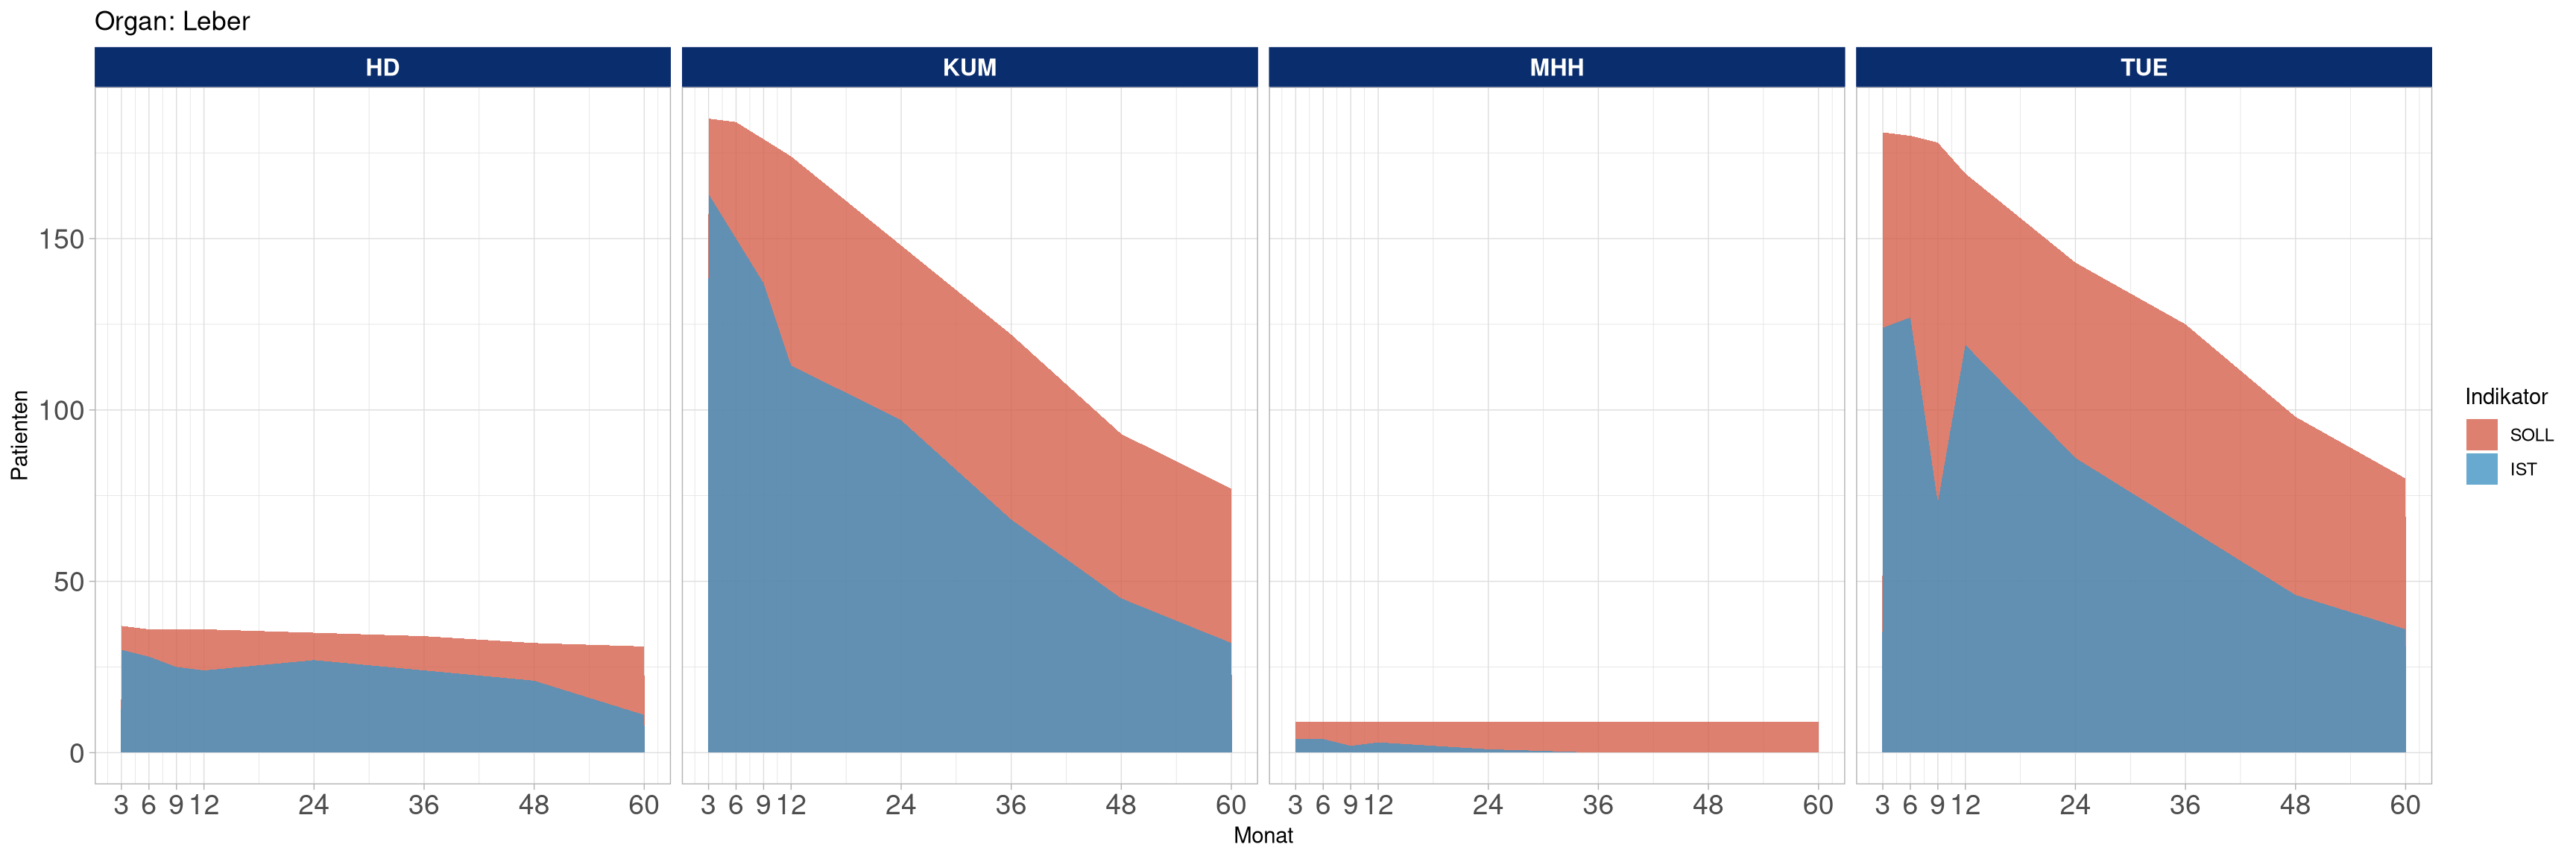
| HD | 30 | 37 | 81.08 | 28 | 36 | 77.78 | 25 | 36 | 69.44 | 24 | 36 | 66.67 | 27 | 36 | 75.00 | 24 | 36 | 66.67 | 21 | 32 | 65.62 | 11 | 32 | 34.38 |
| KUM | 167 | 189 | 88.36 | 157 | 188 | 83.51 | 141 | 185 | 76.22 | 122 | 181 | 67.40 | 113 | 177 | 63.84 | 95 | 162 | 58.64 | 67 | 130 | 51.54 | 43 | 100 | 43.00 |
| MHH | 4 | 9 | 44.44 | 4 | 9 | 44.44 | 2 | 9 | 22.22 | 3 | 9 | 33.33 | 1 | 9 | 11.11 | 0 | 9 | 0.00 | 0 | 9 | 0.00 | 0 | 9 | 0.00 |
| TUE | 144 | 209 | 68.90 | 148 | 208 | 71.15 | 85 | 206 | 41.26 | 141 | 198 | 71.21 | 105 | 180 | 58.33 | 86 | 155 | 55.48 | 62 | 134 | 46.27 | 49 | 107 | 45.79 |
„3 Monate“:
Ist = Anzahl der Teilnehmer, die nach Verlassen der Klinik und bis (3 + 1,5 =) 4,5 Monate nach Transplantation zum FU erschienen sind;
Soll = Anzahl der Teilnehmer, dessen Transplantation zum jetzigen Zeitpunkt länger als 4,5 Monate zurückliegt
„6 Monate“:
Ist = Anzahl der Teilnehmer, die 4,5 bis (6 + 1,5 =) 7,5 Monate nach Transplantation zum FU erschienen sind;
Soll = Anzahl der Teilnehmer, dessen Transplantation zum jetzigen Zeitpunkt länger als 7,5 Monate zurückliegt
…
„24 Monate“:
Ist = Anzahl der Teilnehmer, die (12 + 1,5 =) 13,5 bis (24 + 1,5 =) 25,5 Monate nach Transplantation zum FU erschienen sind;
Soll = Anzahl der Teilnehmer, dessen Transplantation zum jetzigen Zeitpunkt länger als 25,5 Monate zurückliegt
…
Teilnehmende, die verstorben oder lost-to-follow-up sind, oder das Organ verloren haben, werden ab diesem Zeitpunkt nicht mehr in der Berechnung berücksichtigt.
| Zentrum |
IST Stand Monat 3 |
SOLL Stand Monat 3 |
Performance in % Monat 3 |
IST Stand Monat 6 |
SOLL Stand Monat 6 |
Performance in % Monat 6 |
IST Stand Monat 9 |
SOLL Stand Monat 9 |
Performance in % Monat 9 |
IST Stand Monat 12 |
SOLL Stand Monat 12 |
Performance in % Monat 12 |
IST Stand Monat 24 |
SOLL Stand Monat 24 |
Performance in % Monat 24 |
IST Stand Monat 36 |
SOLL Stand Monat 36 |
Performance in % Monat 36 |
IST Stand Monat 48 |
SOLL Stand Monat 48 |
Performance in % Monat 48 |
IST Stand Monat 60 |
SOLL Stand Monat 60 |
Performance in % Monat 60 |
|---|---|---|---|---|---|---|---|---|---|---|---|---|---|---|---|---|---|---|---|---|---|---|---|---|
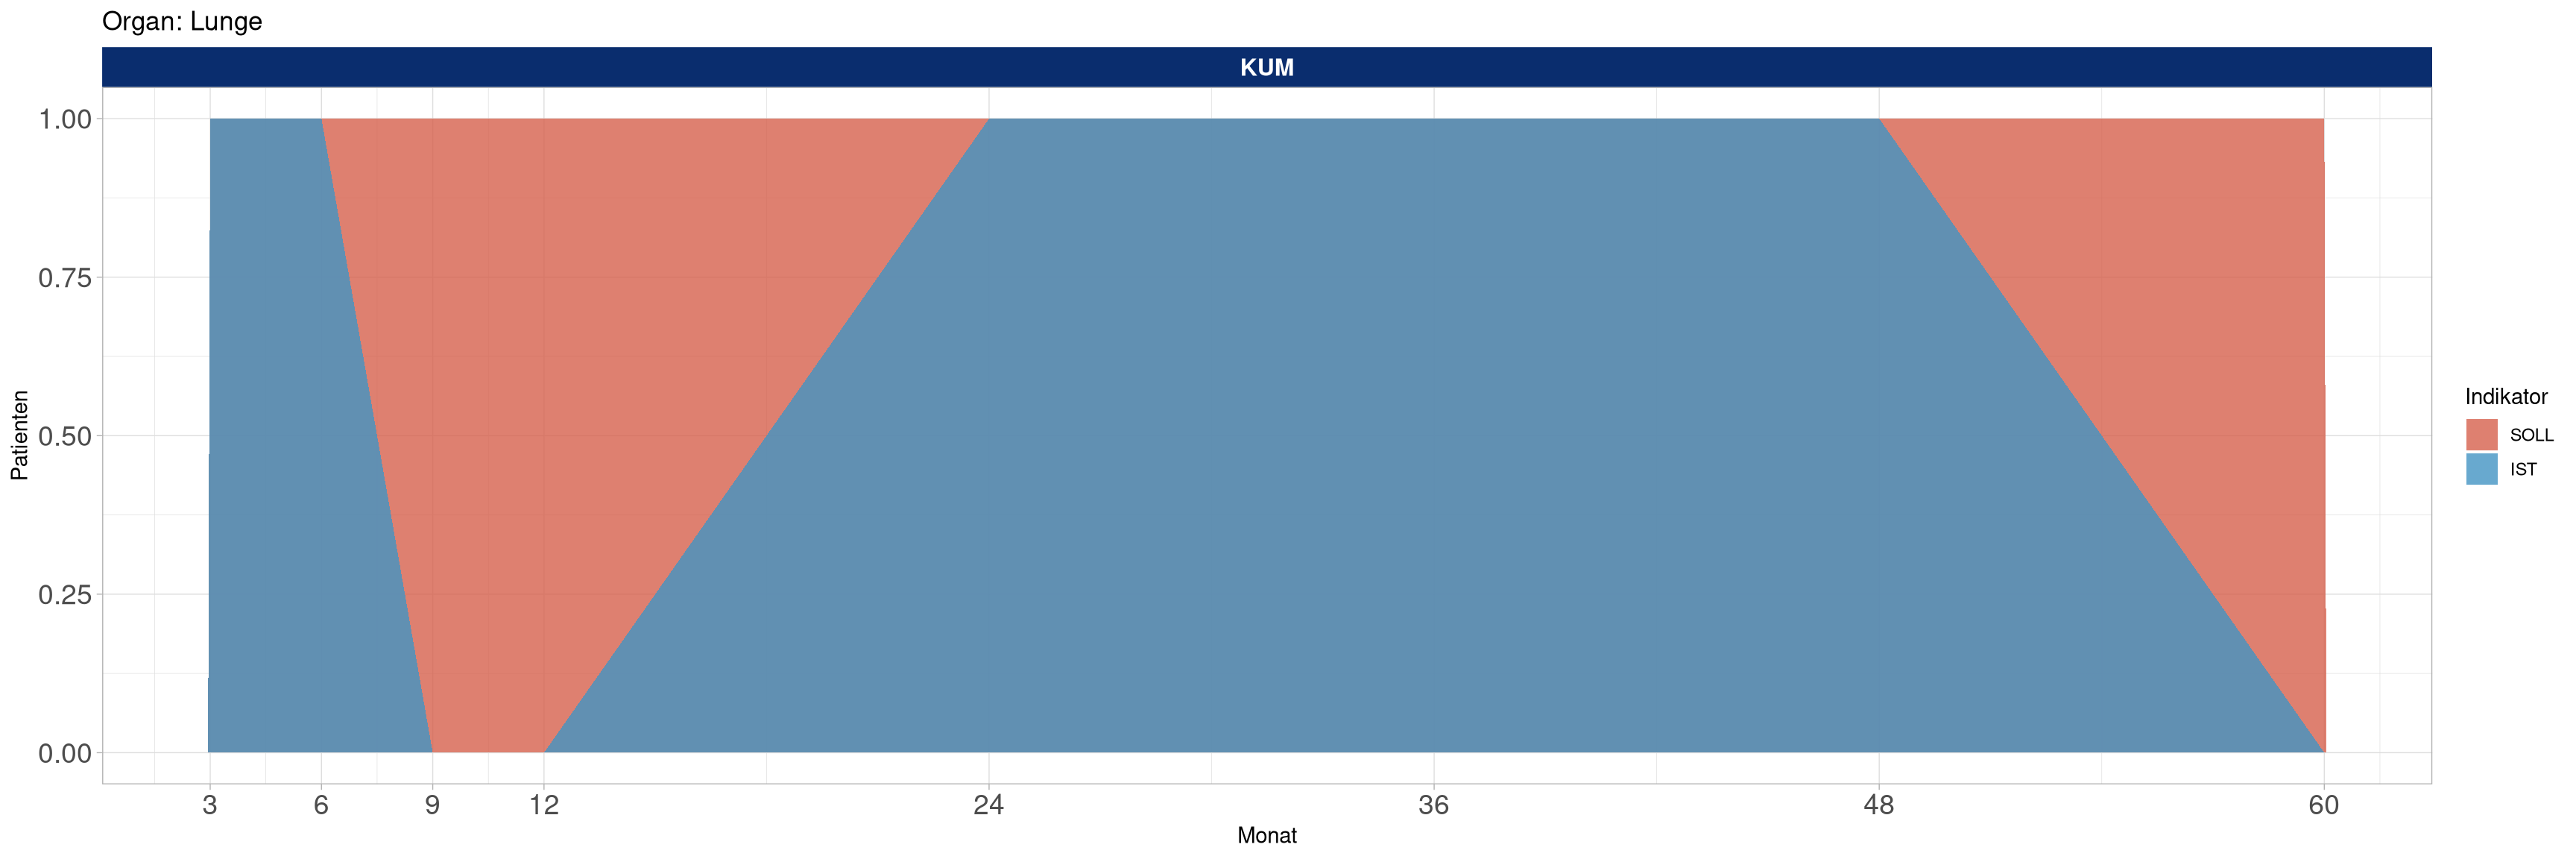
| KUM | 1 | 1 | 100 | 1 | 1 | 100 | 0 | 1 | 0 | 0 | 1 | 0 | 1 | 1 | 100 | 1 | 1 | 100 | 1 | 1 | 100 | 0 | 1 | 0 |
„3 Monate“:
Ist = Anzahl der Teilnehmer, die nach Verlassen der Klinik und bis (3 + 1,5 =) 4,5 Monate nach Transplantation zum FU erschienen sind;
Soll = Anzahl der Teilnehmer, dessen Transplantation zum jetzigen Zeitpunkt länger als 4,5 Monate zurückliegt
„6 Monate“:
Ist = Anzahl der Teilnehmer, die 4,5 bis (6 + 1,5 =) 7,5 Monate nach Transplantation zum FU erschienen sind;
Soll = Anzahl der Teilnehmer, dessen Transplantation zum jetzigen Zeitpunkt länger als 7,5 Monate zurückliegt
…
„24 Monate“:
Ist = Anzahl der Teilnehmer, die (12 + 1,5 =) 13,5 bis (24 + 1,5 =) 25,5 Monate nach Transplantation zum FU erschienen sind;
Soll = Anzahl der Teilnehmer, dessen Transplantation zum jetzigen Zeitpunkt länger als 25,5 Monate zurückliegt
…
Teilnehmende, die verstorben oder lost-to-follow-up sind, oder das Organ verloren haben, werden ab diesem Zeitpunkt nicht mehr in der Berechnung berücksichtigt.
| Zentrum |
IST Stand Monat 3 |
SOLL Stand Monat 3 |
Performance in % Monat 3 |
IST Stand Monat 6 |
SOLL Stand Monat 6 |
Performance in % Monat 6 |
IST Stand Monat 9 |
SOLL Stand Monat 9 |
Performance in % Monat 9 |
IST Stand Monat 12 |
SOLL Stand Monat 12 |
Performance in % Monat 12 |
IST Stand Monat 24 |
SOLL Stand Monat 24 |
Performance in % Monat 24 |
IST Stand Monat 36 |
SOLL Stand Monat 36 |
Performance in % Monat 36 |
IST Stand Monat 48 |
SOLL Stand Monat 48 |
Performance in % Monat 48 |
IST Stand Monat 60 |
SOLL Stand Monat 60 |
Performance in % Monat 60 |
|---|---|---|---|---|---|---|---|---|---|---|---|---|---|---|---|---|---|---|---|---|---|---|---|---|
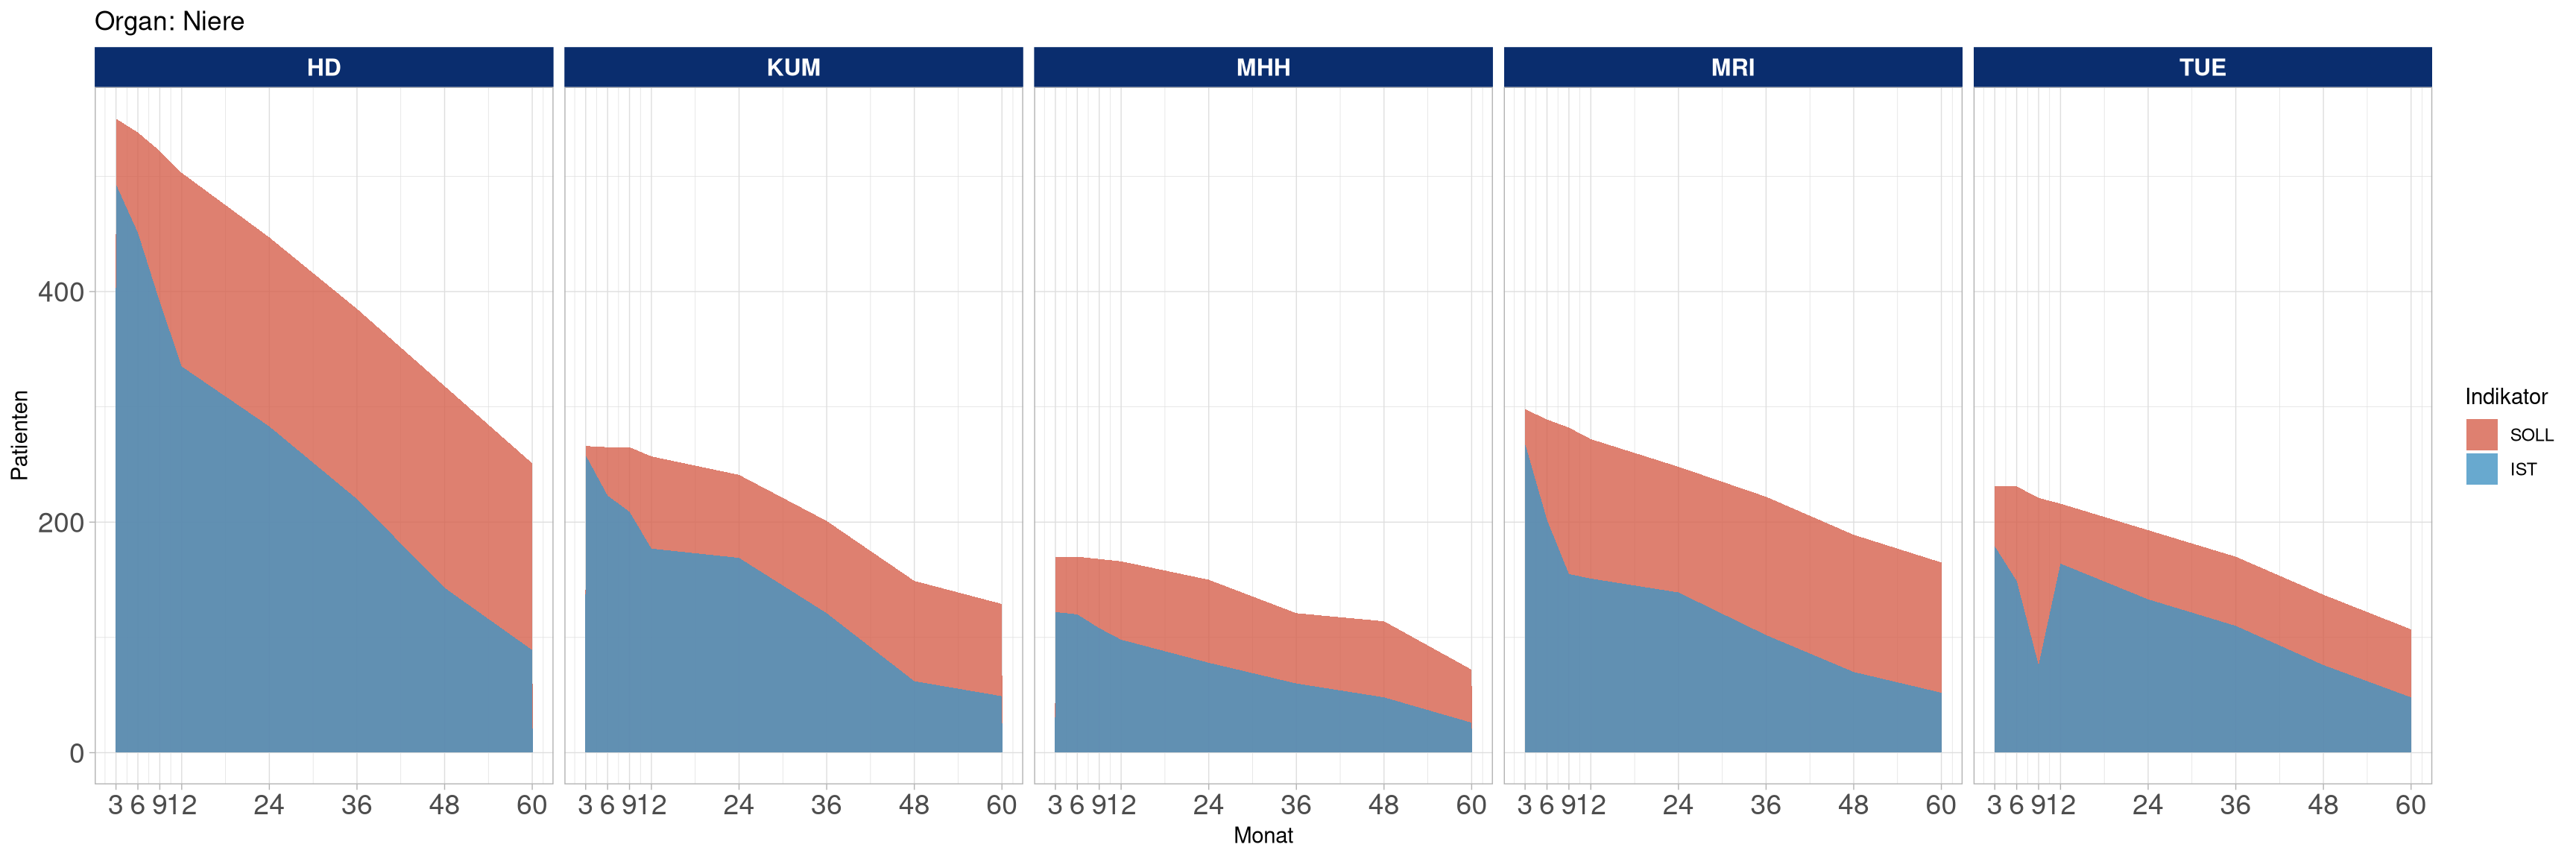
| HD | 536 | 605 | 88.60 | 491 | 600 | 81.83 | 427 | 596 | 71.64 | 372 | 587 | 63.37 | 319 | 536 | 59.51 | 259 | 466 | 55.58 | 175 | 403 | 43.42 | 120 | 344 | 34.88 |
| KUM | 271 | 279 | 97.13 | 232 | 278 | 83.45 | 217 | 276 | 78.62 | 187 | 268 | 69.78 | 189 | 263 | 71.86 | 156 | 245 | 63.67 | 92 | 214 | 42.99 | 68 | 164 | 41.46 |
| MHH | 125 | 175 | 71.43 | 126 | 175 | 72.00 | 113 | 175 | 64.57 | 102 | 175 | 58.29 | 81 | 168 | 48.21 | 64 | 158 | 40.51 | 51 | 124 | 41.13 | 27 | 116 | 23.28 |
| MRI | 290 | 326 | 88.96 | 210 | 316 | 66.46 | 162 | 317 | 51.10 | 164 | 310 | 52.90 | 155 | 290 | 53.45 | 114 | 255 | 44.71 | 86 | 223 | 38.57 | 59 | 195 | 30.26 |
| TUE | 219 | 275 | 79.64 | 188 | 275 | 68.36 | 85 | 268 | 31.72 | 197 | 257 | 76.65 | 151 | 223 | 67.71 | 136 | 204 | 66.67 | 103 | 176 | 58.52 | 71 | 151 | 47.02 |
„3 Monate“:
Ist = Anzahl der Teilnehmer, die nach Verlassen der Klinik und bis (3 + 1,5 =) 4,5 Monate nach Transplantation zum FU erschienen sind;
Soll = Anzahl der Teilnehmer, dessen Transplantation zum jetzigen Zeitpunkt länger als 4,5 Monate zurückliegt
„6 Monate“:
Ist = Anzahl der Teilnehmer, die 4,5 bis (6 + 1,5 =) 7,5 Monate nach Transplantation zum FU erschienen sind;
Soll = Anzahl der Teilnehmer, dessen Transplantation zum jetzigen Zeitpunkt länger als 7,5 Monate zurückliegt
…
„24 Monate“:
Ist = Anzahl der Teilnehmer, die (12 + 1,5 =) 13,5 bis (24 + 1,5 =) 25,5 Monate nach Transplantation zum FU erschienen sind;
Soll = Anzahl der Teilnehmer, dessen Transplantation zum jetzigen Zeitpunkt länger als 25,5 Monate zurückliegt
…
Teilnehmende, die verstorben oder lost-to-follow-up sind, oder das Organ verloren haben, werden ab diesem Zeitpunkt nicht mehr in der Berechnung berücksichtigt.
| Zentrum |
IST Stand Monat 3 |
SOLL Stand Monat 3 |
Performance in % Monat 3 |
IST Stand Monat 6 |
SOLL Stand Monat 6 |
Performance in % Monat 6 |
IST Stand Monat 9 |
SOLL Stand Monat 9 |
Performance in % Monat 9 |
IST Stand Monat 12 |
SOLL Stand Monat 12 |
Performance in % Monat 12 |
IST Stand Monat 24 |
SOLL Stand Monat 24 |
Performance in % Monat 24 |
IST Stand Monat 36 |
SOLL Stand Monat 36 |
Performance in % Monat 36 |
IST Stand Monat 48 |
SOLL Stand Monat 48 |
Performance in % Monat 48 |
IST Stand Monat 60 |
SOLL Stand Monat 60 |
Performance in % Monat 60 |
|---|---|---|---|---|---|---|---|---|---|---|---|---|---|---|---|---|---|---|---|---|---|---|---|---|
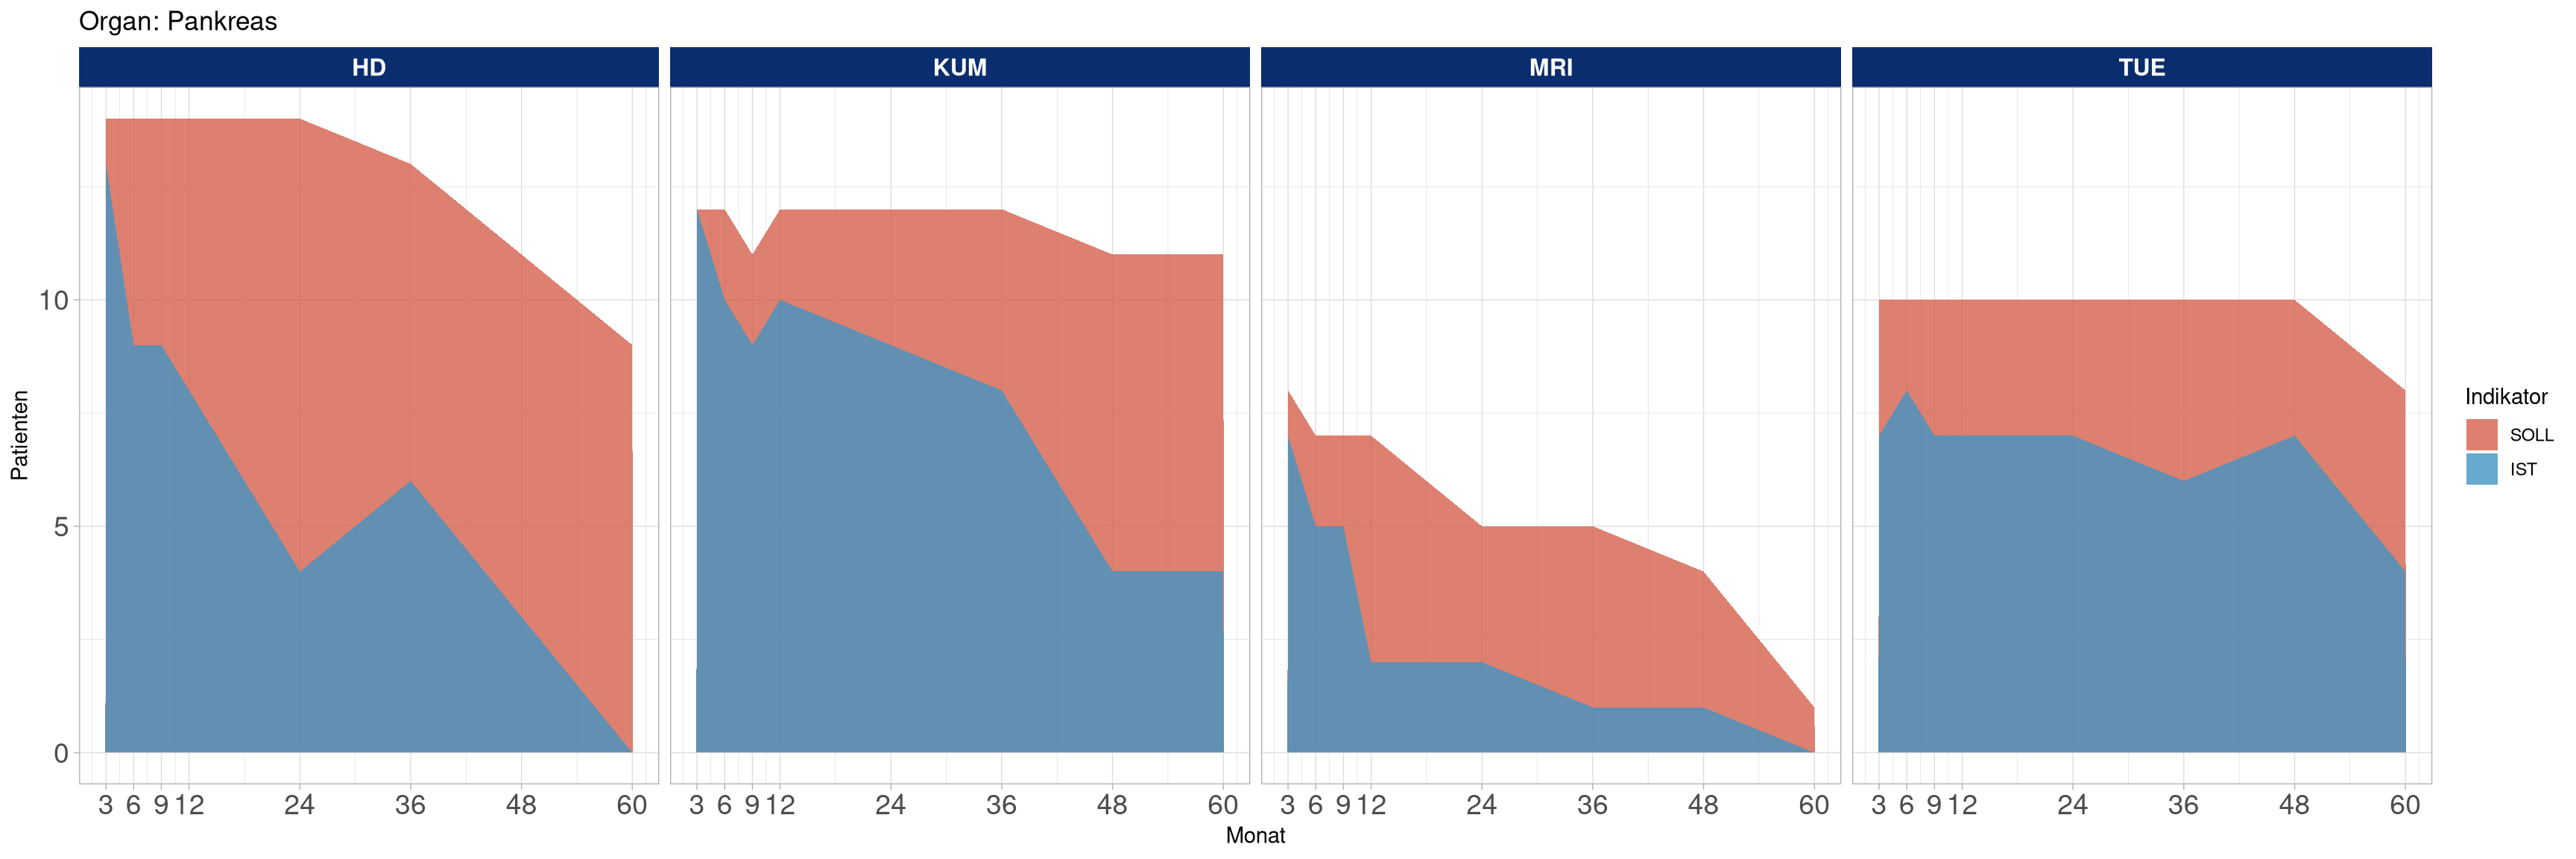
| HD | 13 | 14 | 92.86 | 9 | 14 | 64.29 | 9 | 14 | 64.29 | 8 | 14 | 57.14 | 4 | 14 | 28.57 | 6 | 13 | 46.15 | 3 | 13 | 23.08 | 0 | 12 | 0.00 |
| KUM | 12 | 12 | 100.00 | 10 | 12 | 83.33 | 9 | 11 | 81.82 | 10 | 12 | 83.33 | 9 | 12 | 75.00 | 8 | 12 | 66.67 | 4 | 11 | 36.36 | 4 | 11 | 36.36 |
| MRI | 8 | 10 | 80.00 | 5 | 8 | 62.50 | 6 | 8 | 75.00 | 2 | 8 | 25.00 | 4 | 8 | 50.00 | 1 | 5 | 20.00 | 1 | 5 | 20.00 | 0 | 4 | 0.00 |
| TUE | 7 | 10 | 70.00 | 8 | 10 | 80.00 | 7 | 10 | 70.00 | 7 | 10 | 70.00 | 7 | 10 | 70.00 | 6 | 10 | 60.00 | 7 | 10 | 70.00 | 4 | 10 | 40.00 |
„3 Monate“:
Ist = Anzahl der Teilnehmer, die nach Verlassen der Klinik und bis (3 + 1,5 =) 4,5 Monate nach Transplantation zum FU erschienen sind;
Soll = Anzahl der Teilnehmer, dessen Transplantation zum jetzigen Zeitpunkt länger als 4,5 Monate zurückliegt
„6 Monate“:
Ist = Anzahl der Teilnehmer, die 4,5 bis (6 + 1,5 =) 7,5 Monate nach Transplantation zum FU erschienen sind;
Soll = Anzahl der Teilnehmer, dessen Transplantation zum jetzigen Zeitpunkt länger als 7,5 Monate zurückliegt
…
„24 Monate“:
Ist = Anzahl der Teilnehmer, die (12 + 1,5 =) 13,5 bis (24 + 1,5 =) 25,5 Monate nach Transplantation zum FU erschienen sind;
Soll = Anzahl der Teilnehmer, dessen Transplantation zum jetzigen Zeitpunkt länger als 25,5 Monate zurückliegt
…
Teilnehmende, die verstorben oder lost-to-follow-up sind, oder das Organ verloren haben, werden ab diesem Zeitpunkt nicht mehr in der Berechnung berücksichtigt.
| Zentrum |
IST Stand Monat 3 |
SOLL Stand Monat 3 |
Performance in % Monat 3 |
IST Stand Monat 6 |
SOLL Stand Monat 6 |
Performance in % Monat 6 |
IST Stand Monat 9 |
SOLL Stand Monat 9 |
Performance in % Monat 9 |
IST Stand Monat 12 |
SOLL Stand Monat 12 |
Performance in % Monat 12 |
IST Stand Monat 24 |
SOLL Stand Monat 24 |
Performance in % Monat 24 |
IST Stand Monat 36 |
SOLL Stand Monat 36 |
Performance in % Monat 36 |
IST Stand Monat 48 |
SOLL Stand Monat 48 |
Performance in % Monat 48 |
IST Stand Monat 60 |
SOLL Stand Monat 60 |
Performance in % Monat 60 |
|---|---|---|---|---|---|---|---|---|---|---|---|---|---|---|---|---|---|---|---|---|---|---|---|---|
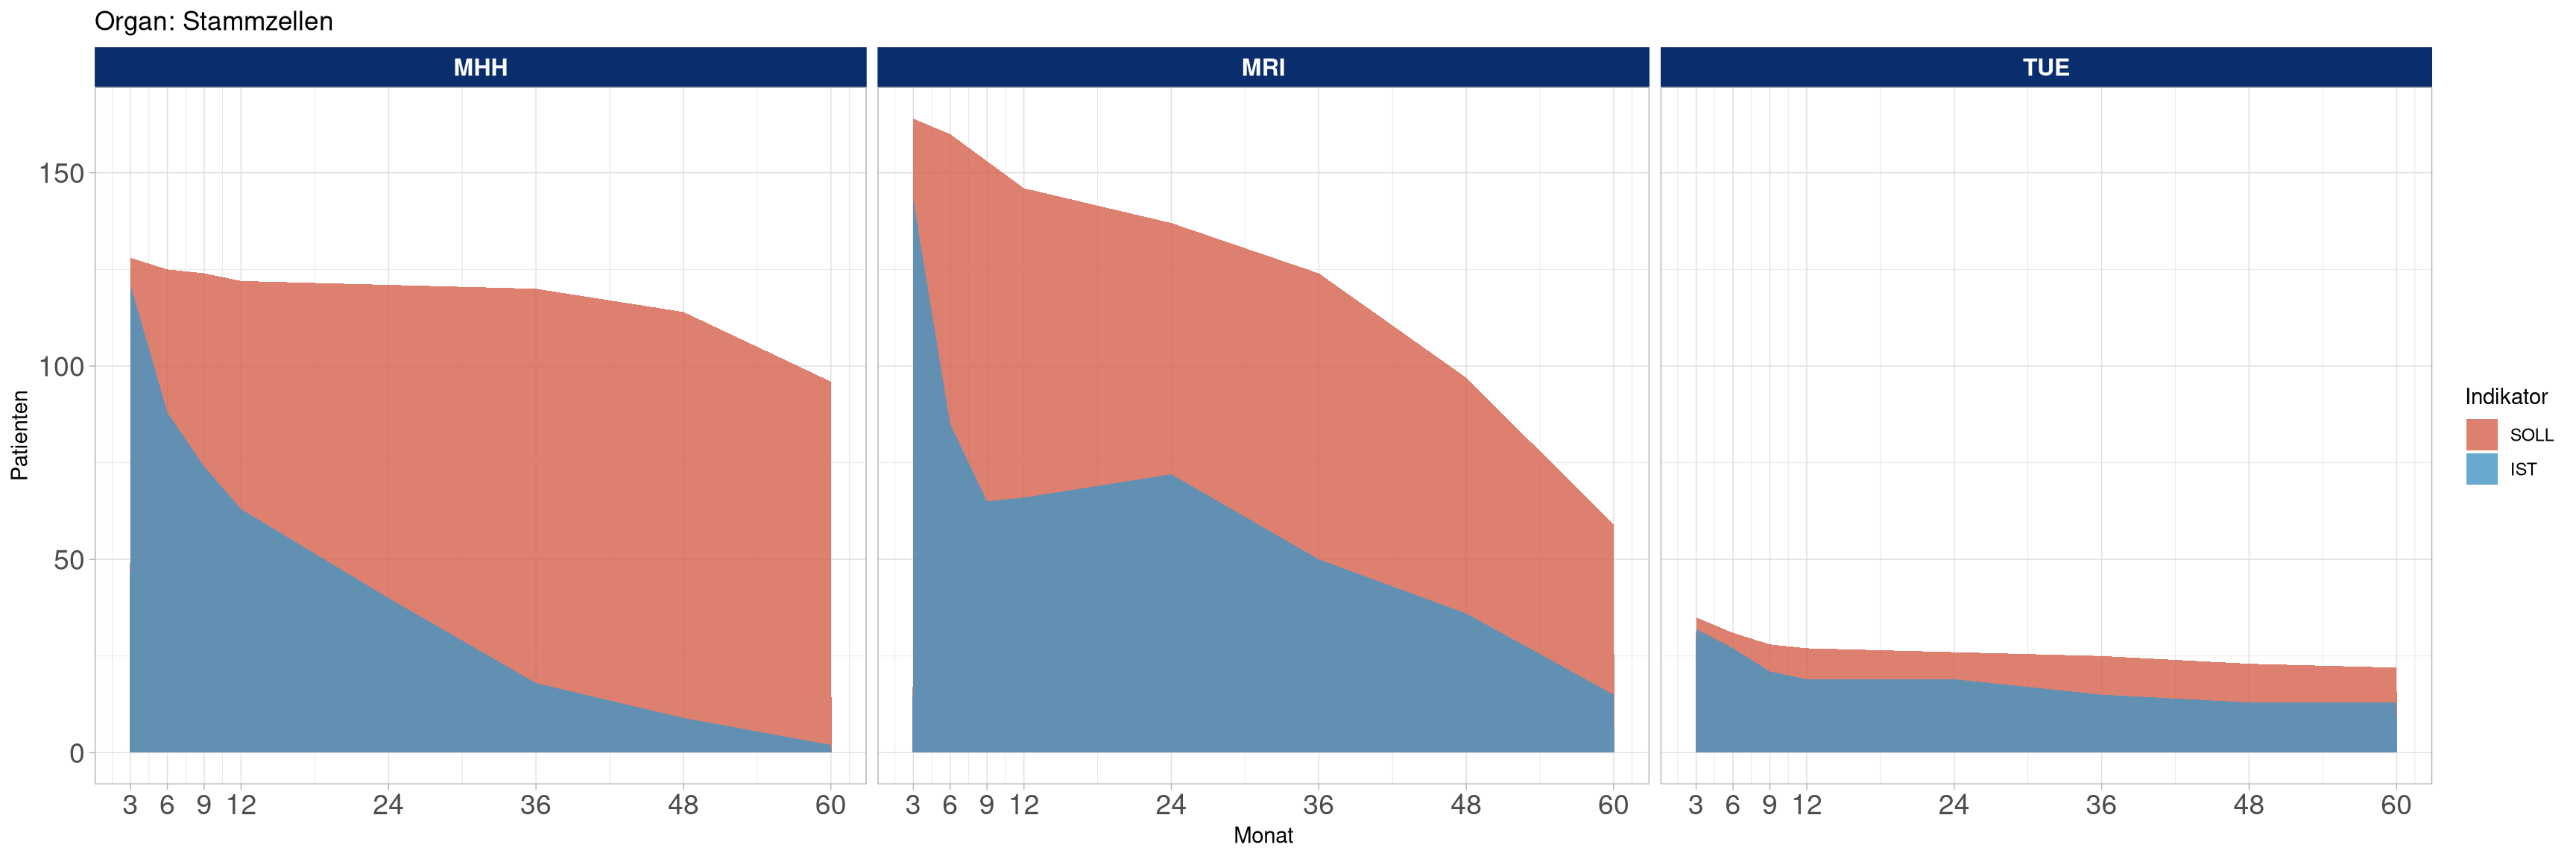
| MHH | 126 | 133 | 94.74 | 90 | 130 | 69.23 | 74 | 130 | 56.92 | 64 | 129 | 49.61 | 41 | 126 | 32.54 | 19 | 122 | 15.57 | 10 | 120 | 8.33 | 3 | 119 | 2.52 |
| MRI | 146 | 184 | 79.35 | 93 | 180 | 51.67 | 73 | 177 | 41.24 | 77 | 175 | 44.00 | 87 | 158 | 55.06 | 59 | 140 | 42.14 | 45 | 128 | 35.16 | 25 | 108 | 23.15 |
| TUE | 33 | 36 | 91.67 | 29 | 32 | 90.62 | 22 | 29 | 75.86 | 21 | 29 | 72.41 | 21 | 28 | 75.00 | 15 | 25 | 60.00 | 15 | 25 | 60.00 | 13 | 23 | 56.52 |
„3 Monate“:
Ist = Anzahl der Teilnehmer, die nach Verlassen der Klinik und bis (3 + 1,5 =) 4,5 Monate nach Transplantation zum FU erschienen sind;
Soll = Anzahl der Teilnehmer, dessen Transplantation zum jetzigen Zeitpunkt länger als 4,5 Monate zurückliegt
„6 Monate“:
Ist = Anzahl der Teilnehmer, die 4,5 bis (6 + 1,5 =) 7,5 Monate nach Transplantation zum FU erschienen sind;
Soll = Anzahl der Teilnehmer, dessen Transplantation zum jetzigen Zeitpunkt länger als 7,5 Monate zurückliegt
…
„24 Monate“:
Ist = Anzahl der Teilnehmer, die (12 + 1,5 =) 13,5 bis (24 + 1,5 =) 25,5 Monate nach Transplantation zum FU erschienen sind;
Soll = Anzahl der Teilnehmer, dessen Transplantation zum jetzigen Zeitpunkt länger als 25,5 Monate zurückliegt
…
Teilnehmende, die verstorben oder lost-to-follow-up sind, oder das Organ verloren haben, werden ab diesem Zeitpunkt nicht mehr in der Berechnung berücksichtigt.
| Virus | Nachweismethode | Herz | Leber | Niere | Pankreas | Stammzellen |
|---|---|---|---|---|---|---|
| HIV | HIV 1/2 PCR | 0/29 | 1/527 | 0/1506 | 1/53 | 0/397 |
| HIV | HIV ELISA | 0/29 | 0/527 | 0/1506 | 0/53 | 0/397 |
| HBV | Anti-HBc Antibody | 1/29 | 46/543 | 0/1741 | 47/55 | 1/407 |
| HBV | Anti-HBs Antibody | 0/29 | 125/543 | 0/1741 | 428/55 | 18/407 |
| HBV | HBV PCR | 0/29 | 4/543 | 0/1741 | 1/55 | 0/407 |
| HBV | HBs Antigen | 0/29 | 23/543 | 0/1741 | 14/55 | 0/407 |
| HCV | Anti-HCV Antibody | 0/29 | 43/545 | 0/1741 | 22/56 | 1/407 |
| HCV | HCV PCR | 0/29 | 7/545 | 0/1741 | 1/56 | 0/407 |
| CMV | Anti-CMV IgG | 14/25 | 265/532 | 0/1763 | 836/53 | 25/396 |
| CMV | Anti-CMV IgM | 3/25 | 15/532 | 0/1763 | 50/53 | 2/396 |
| CMV | CMV PCR | 0/25 | 1/532 | 0/1763 | 5/53 | 0/396 |
| EBV | Anti-EBV IgG (Anti-EBNA) | 21/25 | 286/482 | 0/1595 | 1015/52 | 42/372 |
| EBV | Anti-EBV IgG (Anti-VCA) | 15/25 | 185/482 | 0/1595 | 779/52 | 31/372 |
| EBV | Anti-EBV IgM (Anti-EA) | 1/25 | 13/482 | 0/1595 | 23/52 | 0/372 |
| EBV | Anti-EBV IgM (Anti-VCA) | 0/25 | 2/482 | 0/1595 | 4/52 | 0/372 |
| EBV | EBV PCR | 0/25 | 3/482 | 0/1595 | 2/52 | 0/372 |
Darstellung von Infektionen, deren Dokumentation aufgrund eines ärztlichen Befundes oder eines Laborbefundes einen relevanten Bezug zum Patienten darstellt. Diese Statistik ermöglicht eine Einschätzung zu möglichen vorhandenen Fallzahlen, stellt aber keine in jedem Fall gesicherte Diagnose dar. Für eine gesicherte Diagnose werden im Falle einer Beantragung von medizinischen Daten aus der Transplantationskohorte detaillierte Angaben zum Nachweis des Erregers zur Verfügung gestellt.
| Bakterium | Leber | Lunge | Niere | Pankreas | Stammzellen |
|---|---|---|---|---|---|
| Acinetobacter sp. | 0 | 0 | 1 | 0 | 1 |
| Actinomyces sp. | 0 | 0 | 1 | 0 | 0 |
| Bacteroides fragilis | 0 | 0 | 2 | 0 | 0 |
| Clostridium sp. | 2 | 0 | 21 | 0 | 8 |
| E.coli | 30 | 0 | 70 | 5 | 42 |
| Haemophilus influenzae | 0 | 0 | 0 | 0 | 1 |
| Legionella sp. | 0 | 0 | 0 | 0 | 1 |
| M. tuberculosis | 4 | 0 | 0 | 0 | 0 |
| Other Mycobacteria | 0 | 0 | 2 | 1 | 0 |
| Other anaerobic bacteria | 0 | 0 | 2 | 0 | 1 |
| Other bacteria | 10 | 0 | 9 | 1 | 18 |
| Other enterobacteria | 12 | 0 | 14 | 0 | 4 |
| Other gram positive bacteria | 5 | 0 | 6 | 0 | 9 |
| Other non-enteric gram negative bacteria | 1 | 0 | 4 | 0 | 0 |
| Pseudomonas aeruginosa | 11 | 1 | 22 | 2 | 14 |
| Staphylococcus aureus | 11 | 0 | 15 | 1 | 8 |
| Staphylococcus sp. coagulase negative | 22 | 0 | 83 | 8 | 40 |
| Stenotrophomonas | 0 | 0 | 1 | 0 | 2 |
| Streptococcus pneumoniae | 0 | 0 | 0 | 0 | 1 |
| Streptococcus sp. | 8 | 0 | 6 | 0 | 10 |
| Virus | Leber | Niere | Stammzellen |
|---|---|---|---|
| Adenovirus | 0 | 0 | 8 |
| BK-Virus | 0 | 4 | 18 |
| CMV | 9 | 9 | 17 |
| Coronavirus | 0 | 0 | 1 |
| EBV | 1 | 0 | 8 |
| Enterovirus | 0 | 1 | 0 |
| HHV-6 | 3 | 0 | 4 |
| HSV-1 | 4 | 4 | 11 |
| HSV-2 | 0 | 1 | 3 |
| Hepatitis B Virus | 0 | 2 | 1 |
| Hepatitis C Virus | 1 | 1 | 0 |
| Hepatitis E Virus | 0 | 0 | 2 |
| Humanes Metapneumovirus | 0 | 0 | 2 |
| Influenza A | 1 | 3 | 2 |
| JC Virus | 0 | 0 | 2 |
| Norovirus | 1 | 2 | 1 |
| RSV | 0 | 2 | 0 |
| Rhinovirus | 0 | 0 | 2 |
| VZV | 0 | 3 | 0 |
| Fungus | Leber | Niere | Pankreas | Stammzellen |
|---|---|---|---|---|
| Aspergillus fumigatus | 4 | 1 | 1 | 7 |
| Aspergillus non-fumigatus | 2 | 0 | 1 | 2 |
| Candida albicans | 25 | 11 | 4 | 16 |
| Candida non-albicans | 13 | 7 | 0 | 7 |
| Cryptococcus neoformans | 0 | 1 | 0 | 0 |
| Fungus unidentified | 1 | 2 | 0 | 6 |
| Other fungi | 5 | 4 | 1 | 6 |
| Pneumocystis sp. | 1 | 0 | 0 | 3 |
| Zygomycetes | 0 | 1 | 0 | 0 |
Darstellung von Virusinfektionen, deren Dokumentation aufgrund eines ärztlichen Befundes oder eines Laborbefundes einen relevanten Bezug zum Patienten darstellt. Diese Statistik ermöglicht eine Einschätzung zu möglichen vorhandenen Fallzahlen, stellt aber keine in jedem Fall gesicherte Diagnose dar. Für eine gesicherte Diagnose werden im Falle einer Beantragung von medizinischen Daten aus der Transplantationskohorte detaillierte Angaben zum Nachweis des Erregers zur Verfügung gestellt.
| Virus |
|---|
| Hepatitis A Virus |
| Hepatitis B Virus |
| Hepatitis C Virus |
| Hepatitis D Virus |
| Hepatitis E Virus |
| HIV |
| CMV |
| EBV |
| BK-Virus |
| JC Virus |
| WU-Virus |
| KI-Virus |
| Adenovirus |
| Norovirus |
| HSV-1 |
| HSV-2 |
| VZV |
| HHV-6 |
| HHV-8 |
| Influenza A |
| Influenza B |
| RSV |
| Parainfluenzavirus |
| Coronavirus |
| SARS-CoV-2 |
| Humanes Metapneumovirus |
| Rhinovirus |
| Enterovirus |
| Parvovirus B19 |
| Virus | Leber | Niere | Pankreas |
|---|---|---|---|
| Hepatitis B Virus | 1 | 1 | 0 |
| Hepatitis C Virus | 1 | 0 | 0 |
| Hepatitis D Virus | 0 | 1 | 0 |
| CMV | 14 | 81 | 7 |
| EBV | 1 | 2 | 0 |
| BK-Virus | 0 | 88 | 0 |
| Adenovirus | 0 | 1 | 0 |
| Norovirus | 2 | 4 | 0 |
| HSV-1 | 0 | 6 | 0 |
| HSV-2 | 0 | 4 | 0 |
| VZV | 1 | 2 | 0 |
| HHV-6 | 0 | 1 | 0 |
| Influenza A | 1 | 5 | 0 |
| RSV | 0 | 8 | 0 |
| Parainfluenzavirus | 0 | 1 | 0 |
| Humanes Metapneumovirus | 0 | 1 | 0 |
| Rhinovirus | 0 | 1 | 0 |
| Enterovirus | 0 | 1 | 0 |
| Virus | Leber | Niere | Pankreas | Stammzellen |
|---|---|---|---|---|
| Hepatitis E Virus | 2 | 2 | 0 | 0 |
| CMV | 21 | 89 | 3 | 11 |
| EBV | 2 | 5 | 0 | 13 |
| BK-Virus | 0 | 96 | 2 | 4 |
| JC Virus | 0 | 2 | 0 | 2 |
| Adenovirus | 0 | 1 | 0 | 3 |
| Norovirus | 0 | 2 | 0 | 1 |
| HSV-1 | 1 | 2 | 0 | 4 |
| HSV-2 | 1 | 1 | 0 | 1 |
| VZV | 1 | 3 | 0 | 0 |
| HHV-6 | 0 | 1 | 0 | 4 |
| Influenza A | 0 | 2 | 0 | 2 |
| RSV | 0 | 0 | 0 | 3 |
| Parainfluenzavirus | 0 | 1 | 0 | 2 |
| Coronavirus | 0 | 1 | 0 | 0 |
| Parvovirus B19 | 0 | 0 | 0 | 1 |
| Virus | Leber | Niere | Pankreas | Stammzellen |
|---|---|---|---|---|
| Hepatitis B Virus | 0 | 1 | 0 | 0 |
| Hepatitis C Virus | 1 | 0 | 0 | 0 |
| Hepatitis E Virus | 0 | 1 | 0 | 0 |
| CMV | 11 | 55 | 4 | 5 |
| EBV | 1 | 2 | 1 | 5 |
| BK-Virus | 0 | 41 | 0 | 0 |
| JC Virus | 0 | 1 | 0 | 2 |
| Adenovirus | 0 | 0 | 0 | 3 |
| Norovirus | 0 | 1 | 0 | 1 |
| HSV-1 | 0 | 2 | 0 | 2 |
| HSV-2 | 0 | 1 | 0 | 0 |
| VZV | 0 | 1 | 0 | 3 |
| HHV-6 | 0 | 0 | 0 | 2 |
| Influenza A | 1 | 4 | 0 | 1 |
| RSV | 0 | 3 | 0 | 2 |
| Parainfluenzavirus | 0 | 0 | 0 | 1 |
| Coronavirus | 0 | 1 | 0 | 1 |
| Rhinovirus | 0 | 0 | 0 | 1 |
| Enterovirus | 0 | 2 | 0 | 0 |
| Virus | Leber | Niere | Stammzellen |
|---|---|---|---|
| Hepatitis E Virus | 0 | 3 | 0 |
| CMV | 6 | 42 | 5 |
| EBV | 1 | 2 | 8 |
| BK-Virus | 0 | 43 | 2 |
| Adenovirus | 0 | 1 | 5 |
| Norovirus | 0 | 0 | 2 |
| HSV-1 | 0 | 1 | 2 |
| HSV-2 | 0 | 1 | 0 |
| VZV | 0 | 1 | 1 |
| HHV-6 | 1 | 0 | 1 |
| Influenza A | 2 | 5 | 1 |
| RSV | 0 | 1 | 4 |
| Parainfluenzavirus | 0 | 1 | 1 |
| Humanes Metapneumovirus | 0 | 0 | 1 |
| Parvovirus B19 | 0 | 1 | 0 |
| Virus | Leber | Niere | Pankreas | Stammzellen |
|---|---|---|---|---|
| Hepatitis E Virus | 0 | 3 | 1 | 1 |
| CMV | 1 | 9 | 1 | 4 |
| EBV | 0 | 3 | 0 | 6 |
| BK-Virus | 0 | 10 | 0 | 4 |
| JC Virus | 0 | 1 | 0 | 2 |
| Adenovirus | 0 | 1 | 0 | 1 |
| Norovirus | 1 | 2 | 0 | 0 |
| HSV-1 | 0 | 2 | 0 | 2 |
| HSV-2 | 0 | 0 | 0 | 2 |
| VZV | 0 | 1 | 0 | 0 |
| HHV-6 | 0 | 0 | 0 | 1 |
| Influenza A | 0 | 1 | 0 | 2 |
| RSV | 0 | 1 | 0 | 1 |
| Parainfluenzavirus | 0 | 1 | 0 | 0 |
| Coronavirus | 0 | 0 | 0 | 1 |
| Humanes Metapneumovirus | 0 | 0 | 0 | 1 |
| Rhinovirus | 0 | 0 | 0 | 1 |
| Virus | Leber | Niere | Pankreas | Stammzellen |
|---|---|---|---|---|
| Hepatitis E Virus | 1 | 0 | 0 | 0 |
| CMV | 2 | 16 | 1 | 2 |
| EBV | 1 | 1 | 1 | 5 |
| BK-Virus | 0 | 19 | 1 | 3 |
| Adenovirus | 1 | 0 | 0 | 1 |
| Norovirus | 0 | 4 | 0 | 0 |
| HSV-1 | 1 | 5 | 0 | 1 |
| HSV-2 | 0 | 0 | 0 | 1 |
| VZV | 0 | 8 | 1 | 1 |
| Influenza A | 1 | 1 | 0 | 1 |
| RSV | 1 | 0 | 0 | 2 |
| Parainfluenzavirus | 0 | 1 | 0 | 0 |
| Coronavirus | 0 | 0 | 0 | 2 |
| Rhinovirus | 0 | 1 | 0 | 2 |
| Virus | Herz | Leber | Niere | Pankreas | Stammzellen |
|---|---|---|---|---|---|
| Hepatitis B Virus | 0 | 0 | 2 | 0 | 1 |
| Hepatitis E Virus | 0 | 0 | 1 | 0 | 2 |
| CMV | 0 | 1 | 26 | 0 | 5 |
| EBV | 0 | 0 | 3 | 1 | 3 |
| BK-Virus | 0 | 1 | 21 | 0 | 1 |
| JC Virus | 0 | 0 | 0 | 0 | 1 |
| Adenovirus | 0 | 0 | 1 | 0 | 1 |
| Norovirus | 0 | 0 | 4 | 0 | 0 |
| HSV-1 | 0 | 1 | 4 | 0 | 1 |
| HSV-2 | 0 | 0 | 1 | 0 | 0 |
| VZV | 0 | 1 | 7 | 1 | 0 |
| Influenza A | 0 | 1 | 3 | 0 | 1 |
| RSV | 0 | 2 | 3 | 0 | 1 |
| Parainfluenzavirus | 0 | 0 | 1 | 0 | 1 |
| Coronavirus | 1 | 0 | 0 | 0 | 0 |
| Humanes Metapneumovirus | 0 | 0 | 0 | 0 | 1 |
| Rhinovirus | 0 | 0 | 0 | 0 | 1 |
| Virus | Leber | Niere | Pankreas | Stammzellen |
|---|---|---|---|---|
| Hepatitis B Virus | 1 | 0 | 0 | 0 |
| Hepatitis E Virus | 0 | 2 | 1 | 0 |
| CMV | 2 | 12 | 0 | 1 |
| EBV | 3 | 1 | 0 | 2 |
| BK-Virus | 0 | 17 | 0 | 0 |
| JC Virus | 0 | 1 | 0 | 0 |
| Norovirus | 1 | 1 | 0 | 0 |
| HSV-1 | 1 | 5 | 0 | 2 |
| HSV-2 | 1 | 3 | 0 | 0 |
| VZV | 0 | 1 | 0 | 0 |
| Influenza A | 0 | 5 | 0 | 0 |
| RSV | 0 | 2 | 0 | 1 |
| Coronavirus | 0 | 1 | 0 | 1 |
| Virus | Leber | Niere | Stammzellen |
|---|---|---|---|
| Hepatitis B Virus | 0 | 1 | 0 |
| Hepatitis E Virus | 4 | 3 | 0 |
| CMV | 5 | 19 | 2 |
| EBV | 0 | 5 | 0 |
| BK-Virus | 0 | 15 | 2 |
| JC Virus | 0 | 1 | 1 |
| Adenovirus | 0 | 1 | 2 |
| Norovirus | 0 | 10 | 2 |
| HSV-1 | 1 | 12 | 2 |
| HSV-2 | 0 | 4 | 1 |
| VZV | 1 | 7 | 2 |
| Influenza A | 1 | 4 | 3 |
| RSV | 1 | 0 | 1 |
| Parainfluenzavirus | 0 | 1 | 0 |
| Coronavirus | 0 | 1 | 0 |
| Rhinovirus | 1 | 1 | 0 |
| Enterovirus | 0 | 2 | 0 |
Darstellung von bakteriellen Infektionen, deren Dokumentation aufgrund eines ärztlichen Befundes oder eines Laborbefundes einen relevanten Bezug zum Patienten darstellt. Diese Statistik ermöglicht eine Einschätzung zu möglichen vorhandenen Fallzahlen, stellt aber keine in jedem Fall gesicherte Diagnose dar. Für eine gesicherte Diagnose werden im Falle einer Beantragung von medizinischen Daten aus der Transplantationskohorte detaillierte Angaben zum Nachweis des Erregers zur Verfügung gestellt.
| Bakterium | Herz | Leber | Lunge | Niere | Pankreas | Stammzellen |
|---|---|---|---|---|---|---|
| Acinetobacter sp. | 0 | 1 | 0 | 5 | 0 | 0 |
| Actinomyces sp. | 0 | 0 | 0 | 2 | 0 | 0 |
| Bacteroides fragilis | 0 | 1 | 0 | 3 | 0 | 0 |
| Burkholderia cepacia | 0 | 0 | 0 | 1 | 0 | 0 |
| Clostridium sp. | 0 | 35 | 0 | 94 | 3 | 10 |
| E.coli | 1 | 112 | 0 | 597 | 9 | 39 |
| Haemophilus influenzae | 0 | 2 | 0 | 14 | 0 | 2 |
| Legionella sp. | 0 | 0 | 0 | 3 | 0 | 0 |
| M. tuberculosis | 0 | 0 | 0 | 1 | 0 | 0 |
| Other Mycobacteria | 0 | 2 | 0 | 6 | 0 | 0 |
| Other anaerobic bacteria | 0 | 5 | 0 | 8 | 0 | 1 |
| Other enterobacteria | 0 | 14 | 0 | 49 | 3 | 6 |
| Other gram positive bacteria | 0 | 5 | 0 | 33 | 4 | 3 |
| Other non-enteric gram negative bacteria | 0 | 11 | 0 | 31 | 2 | 0 |
| Pseudomonas aeruginosa | 0 | 37 | 1 | 177 | 9 | 14 |
| Staphylococcus sp. coagulase negative | 0 | 30 | 0 | 124 | 2 | 16 |
| Staphylococcus aureus | 0 | 34 | 0 | 52 | 1 | 15 |
| Stenotrophomonas | 0 | 4 | 0 | 3 | 1 | 0 |
| Streptococcus pneumoniae | 0 | 1 | 0 | 16 | 0 | 3 |
| Streptococcus sp. | 0 | 39 | 0 | 69 | 1 | 1 |
| Other bacteria | 0 | 18 | 0 | 100 | 3 | 8 |
| Bakterium | Leber | Niere | Pankreas |
|---|---|---|---|
| Acinetobacter sp. | 0 | 2 | 0 |
| Bacteroides fragilis | 0 | 2 | 0 |
| Burkholderia cepacia | 0 | 1 | 0 |
| Clostridium sp. | 4 | 29 | 1 |
| E.coli | 15 | 132 | 2 |
| Haemophilus influenzae | 0 | 1 | 0 |
| Other Mycobacteria | 0 | 1 | 0 |
| Other anaerobic bacteria | 0 | 4 | 0 |
| Other enterobacteria | 1 | 12 | 0 |
| Other gram positive bacteria | 0 | 14 | 3 |
| Other non-enteric gram negative bacteria | 1 | 4 | 0 |
| Pseudomonas aeruginosa | 7 | 60 | 4 |
| Staphylococcus sp. coagulase negative | 14 | 50 | 1 |
| Staphylococcus aureus | 13 | 8 | 0 |
| Stenotrophomonas | 1 | 1 | 0 |
| Streptococcus pneumoniae | 0 | 2 | 0 |
| Streptococcus sp. | 4 | 7 | 0 |
| Other bacteria | 6 | 20 | 1 |
| Bakterium | Leber | Niere | Pankreas | Stammzellen |
|---|---|---|---|---|
| Acinetobacter sp. | 0 | 1 | 0 | 0 |
| Actinomyces sp. | 0 | 1 | 0 | 0 |
| Clostridium sp. | 7 | 23 | 1 | 2 |
| E.coli | 12 | 87 | 0 | 8 |
| Haemophilus influenzae | 0 | 1 | 0 | 0 |
| Other Mycobacteria | 1 | 1 | 0 | 0 |
| Other anaerobic bacteria | 0 | 1 | 0 | 0 |
| Other enterobacteria | 5 | 7 | 0 | 0 |
| Other gram positive bacteria | 0 | 5 | 0 | 2 |
| Other non-enteric gram negative bacteria | 4 | 5 | 0 | 0 |
| Pseudomonas aeruginosa | 6 | 25 | 0 | 4 |
| Staphylococcus sp. coagulase negative | 6 | 17 | 1 | 3 |
| Staphylococcus aureus | 5 | 8 | 0 | 3 |
| Stenotrophomonas | 1 | 0 | 0 | 0 |
| Streptococcus pneumoniae | 0 | 2 | 0 | 0 |
| Streptococcus sp. | 5 | 7 | 0 | 0 |
| Other bacteria | 4 | 21 | 2 | 3 |
| Bakterium | Herz | Leber | Niere | Pankreas | Stammzellen |
|---|---|---|---|---|---|
| Acinetobacter sp. | 0 | 0 | 1 | 0 | 0 |
| Clostridium sp. | 0 | 2 | 9 | 0 | 5 |
| E.coli | 1 | 9 | 48 | 1 | 7 |
| Haemophilus influenzae | 0 | 0 | 2 | 0 | 0 |
| Other Mycobacteria | 0 | 0 | 1 | 0 | 0 |
| Other anaerobic bacteria | 0 | 1 | 0 | 0 | 1 |
| Other enterobacteria | 0 | 0 | 1 | 0 | 1 |
| Other gram positive bacteria | 0 | 1 | 1 | 0 | 0 |
| Other non-enteric gram negative bacteria | 0 | 1 | 1 | 0 | 0 |
| Pseudomonas aeruginosa | 0 | 5 | 17 | 0 | 4 |
| Staphylococcus sp. coagulase negative | 0 | 0 | 8 | 0 | 1 |
| Staphylococcus aureus | 0 | 0 | 7 | 0 | 7 |
| Stenotrophomonas | 0 | 1 | 1 | 1 | 0 |
| Streptococcus pneumoniae | 0 | 0 | 3 | 0 | 0 |
| Streptococcus sp. | 0 | 3 | 4 | 0 | 0 |
| Other bacteria | 0 | 1 | 9 | 0 | 4 |
| Bakterium | Leber | Niere | Stammzellen |
|---|---|---|---|
| Actinomyces sp. | 0 | 1 | 0 |
| Clostridium sp. | 4 | 9 | 0 |
| E.coli | 12 | 52 | 9 |
| Haemophilus influenzae | 0 | 1 | 0 |
| Other Mycobacteria | 0 | 1 | 0 |
| Other anaerobic bacteria | 2 | 1 | 0 |
| Other enterobacteria | 1 | 3 | 2 |
| Other gram positive bacteria | 1 | 2 | 0 |
| Other non-enteric gram negative bacteria | 1 | 4 | 0 |
| Pseudomonas aeruginosa | 6 | 8 | 1 |
| Staphylococcus sp. coagulase negative | 3 | 11 | 4 |
| Staphylococcus aureus | 0 | 2 | 0 |
| Streptococcus pneumoniae | 0 | 1 | 1 |
| Streptococcus sp. | 5 | 4 | 0 |
| Other bacteria | 1 | 10 | 0 |
| Bakterium | Leber | Lunge | Niere | Pankreas | Stammzellen |
|---|---|---|---|---|---|
| Acinetobacter sp. | 0 | 0 | 1 | 0 | 0 |
| Bacteroides fragilis | 1 | 0 | 0 | 0 | 0 |
| Clostridium sp. | 0 | 0 | 2 | 0 | 0 |
| E.coli | 5 | 0 | 22 | 0 | 4 |
| Legionella sp. | 0 | 0 | 1 | 0 | 0 |
| Other anaerobic bacteria | 1 | 0 | 0 | 0 | 0 |
| Other enterobacteria | 1 | 0 | 0 | 0 | 0 |
| Other gram positive bacteria | 0 | 0 | 3 | 0 | 1 |
| Other non-enteric gram negative bacteria | 0 | 0 | 3 | 2 | 0 |
| Pseudomonas aeruginosa | 0 | 1 | 12 | 0 | 2 |
| Staphylococcus sp. coagulase negative | 2 | 0 | 4 | 0 | 4 |
| Staphylococcus aureus | 1 | 0 | 1 | 0 | 2 |
| Stenotrophomonas | 0 | 0 | 1 | 0 | 0 |
| Streptococcus pneumoniae | 0 | 0 | 1 | 0 | 0 |
| Streptococcus sp. | 2 | 0 | 1 | 0 | 0 |
| Other bacteria | 2 | 0 | 5 | 0 | 0 |
| Bakterium | Leber | Niere | Pankreas | Stammzellen |
|---|---|---|---|---|
| Acinetobacter sp. | 1 | 0 | 0 | 0 |
| Clostridium sp. | 7 | 6 | 1 | 0 |
| E.coli | 19 | 64 | 3 | 4 |
| Legionella sp. | 0 | 1 | 0 | 0 |
| Other Mycobacteria | 0 | 1 | 0 | 0 |
| Other enterobacteria | 0 | 11 | 2 | 1 |
| Other gram positive bacteria | 0 | 2 | 0 | 0 |
| Other non-enteric gram negative bacteria | 0 | 3 | 0 | 0 |
| Pseudomonas aeruginosa | 4 | 16 | 3 | 1 |
| Staphylococcus sp. coagulase negative | 0 | 9 | 0 | 2 |
| Staphylococcus aureus | 3 | 3 | 0 | 0 |
| Streptococcus sp. | 9 | 13 | 0 | 0 |
| Other bacteria | 3 | 8 | 0 | 1 |
| Bakterium | Leber | Niere | Pankreas | Stammzellen |
|---|---|---|---|---|
| Clostridium sp. | 3 | 4 | 0 | 1 |
| E.coli | 8 | 72 | 1 | 4 |
| Haemophilus influenzae | 1 | 1 | 0 | 1 |
| M. tuberculosis | 0 | 1 | 0 | 0 |
| Other Mycobacteria | 0 | 1 | 0 | 0 |
| Other anaerobic bacteria | 1 | 0 | 0 | 0 |
| Other enterobacteria | 3 | 4 | 0 | 0 |
| Other non-enteric gram negative bacteria | 2 | 3 | 0 | 0 |
| Pseudomonas aeruginosa | 4 | 16 | 2 | 1 |
| Staphylococcus sp. coagulase negative | 2 | 15 | 0 | 2 |
| Staphylococcus aureus | 1 | 6 | 0 | 2 |
| Streptococcus pneumoniae | 0 | 1 | 0 | 2 |
| Streptococcus sp. | 5 | 19 | 0 | 1 |
| Other bacteria | 1 | 8 | 0 | 0 |
| Bakterium | Leber | Niere | Pankreas | Stammzellen |
|---|---|---|---|---|
| Clostridium sp. | 1 | 5 | 0 | 0 |
| E.coli | 5 | 44 | 1 | 1 |
| Haemophilus influenzae | 0 | 2 | 0 | 0 |
| Legionella sp. | 0 | 1 | 0 | 0 |
| Other enterobacteria | 1 | 4 | 0 | 0 |
| Other gram positive bacteria | 1 | 0 | 0 | 0 |
| Other non-enteric gram negative bacteria | 0 | 2 | 0 | 0 |
| Pseudomonas aeruginosa | 2 | 12 | 0 | 1 |
| Staphylococcus sp. coagulase negative | 0 | 7 | 0 | 0 |
| Staphylococcus aureus | 4 | 7 | 1 | 0 |
| Streptococcus sp. | 2 | 11 | 1 | 0 |
| Other bacteria | 0 | 8 | 0 | 0 |
| Bakterium | Leber | Niere | Pankreas | Stammzellen |
|---|---|---|---|---|
| Bacteroides fragilis | 0 | 1 | 0 | 0 |
| Clostridium sp. | 7 | 7 | 0 | 2 |
| E.coli | 27 | 76 | 1 | 2 |
| Haemophilus influenzae | 1 | 6 | 0 | 1 |
| Other Mycobacteria | 1 | 0 | 0 | 0 |
| Other anaerobic bacteria | 0 | 2 | 0 | 0 |
| Other enterobacteria | 2 | 7 | 1 | 2 |
| Other gram positive bacteria | 2 | 6 | 1 | 0 |
| Other non-enteric gram negative bacteria | 2 | 6 | 0 | 0 |
| Pseudomonas aeruginosa | 3 | 11 | 0 | 0 |
| Staphylococcus sp. coagulase negative | 3 | 3 | 0 | 0 |
| Staphylococcus aureus | 7 | 10 | 0 | 1 |
| Stenotrophomonas | 1 | 0 | 0 | 0 |
| Streptococcus pneumoniae | 1 | 6 | 0 | 0 |
| Streptococcus sp. | 4 | 3 | 0 | 0 |
| Other bacteria | 0 | 11 | 0 | 0 |
Darstellung von Pilzinfektionen, deren Dokumentation aufgrund eines ärztlichen Befundes oder eines Laborbefundes einen relevanten Bezug zum Patienten darstellt. Diese Statistik ermöglicht eine Einschätzung zu möglichen vorhandenen Fallzahlen, stellt aber keine in jedem Fall gesicherte Diagnose dar. Für eine gesicherte Diagnose werden im Falle einer Beantragung von medizinischen Daten aus der Transplantationskohorte detaillierte Angaben zum Nachweis des Erregers zur Verfügung gestellt.
| Fungus | Leber | Lunge | Niere | Pankreas | Stammzellen |
|---|---|---|---|---|---|
| Aspergillus fumigatus | 7 | 1 | 12 | 0 | 8 |
| Aspergillus non-fumigatus | 2 | 0 | 0 | 0 | 0 |
| Candida albicans | 42 | 0 | 49 | 1 | 9 |
| Candida non-albicans | 24 | 0 | 24 | 7 | 2 |
| Cryptococcus neoformans | 0 | 0 | 3 | 0 | 0 |
| Pneumocystis sp. | 2 | 0 | 21 | 0 | 3 |
| Fungus unidentified | 2 | 0 | 4 | 0 | 1 |
| Other fungi | 4 | 0 | 21 | 2 | 4 |
| Fungus | Leber | Lunge | Niere | Pankreas |
|---|---|---|---|---|
| Aspergillus fumigatus | 2 | 1 | 5 | 0 |
| Aspergillus non-fumigatus | 1 | 0 | 0 | 0 |
| Candida albicans | 17 | 0 | 14 | 1 |
| Candida non-albicans | 18 | 0 | 3 | 2 |
| Pneumocystis sp. | 0 | 0 | 1 | 0 |
| Fungus unidentified | 0 | 0 | 1 | 0 |
| Other fungi | 2 | 0 | 3 | 0 |
| Fungus | Leber | Niere | Pankreas | Stammzellen |
|---|---|---|---|---|
| Aspergillus fumigatus | 2 | 0 | 0 | 3 |
| Candida albicans | 7 | 5 | 0 | 2 |
| Candida non-albicans | 3 | 3 | 0 | 2 |
| Cryptococcus neoformans | 0 | 1 | 0 | 0 |
| Pneumocystis sp. | 1 | 2 | 0 | 0 |
| Fungus unidentified | 1 | 2 | 0 | 0 |
| Other fungi | 1 | 3 | 1 | 1 |
| Fungus | Leber | Niere | Pankreas | Stammzellen |
|---|---|---|---|---|
| Aspergillus fumigatus | 0 | 1 | 0 | 1 |
| Candida albicans | 2 | 6 | 0 | 1 |
| Candida non-albicans | 0 | 3 | 1 | 0 |
| Pneumocystis sp. | 0 | 3 | 0 | 0 |
| Fungus unidentified | 0 | 0 | 0 | 1 |
| Other fungi | 0 | 3 | 1 | 1 |
| Fungus | Leber | Niere | Pankreas | Stammzellen |
|---|---|---|---|---|
| Aspergillus fumigatus | 1 | 1 | 0 | 2 |
| Candida albicans | 3 | 1 | 0 | 0 |
| Candida non-albicans | 1 | 3 | 1 | 0 |
| Pneumocystis sp. | 0 | 4 | 0 | 0 |
| Fungus unidentified | 1 | 1 | 0 | 0 |
| Other fungi | 1 | 2 | 0 | 0 |
| Fungus | Leber | Niere | Pankreas | Stammzellen |
|---|---|---|---|---|
| Candida albicans | 1 | 2 | 0 | 0 |
| Candida non-albicans | 0 | 2 | 1 | 0 |
| Pneumocystis sp. | 0 | 1 | 0 | 0 |
| Other fungi | 0 | 0 | 0 | 1 |
| Fungus | Leber | Niere | Pankreas |
|---|---|---|---|
| Candida albicans | 3 | 6 | 0 |
| Candida non-albicans | 0 | 6 | 1 |
| Pneumocystis sp. | 0 | 3 | 0 |
| Other fungi | 0 | 4 | 0 |
| Fungus | Leber | Niere | Pankreas | Stammzellen |
|---|---|---|---|---|
| Aspergillus fumigatus | 0 | 1 | 0 | 0 |
| Aspergillus non-fumigatus | 1 | 0 | 0 | 0 |
| Candida albicans | 3 | 6 | 0 | 3 |
| Candida non-albicans | 1 | 3 | 1 | 0 |
| Pneumocystis sp. | 0 | 4 | 0 | 1 |
| Other fungi | 0 | 2 | 0 | 1 |
| Fungus | Niere | Stammzellen |
|---|---|---|
| Aspergillus fumigatus | 2 | 1 |
| Candida albicans | 2 | 0 |
| Candida non-albicans | 1 | 0 |
| Pneumocystis sp. | 1 | 2 |
| Fungus | Leber | Niere | Stammzellen |
|---|---|---|---|
| <i>Aspergillus fumigatus</i> | 2 | 2 | 1 |
| <i>Candida albicans</i> | 6 | 7 | 3 |
| <i>Candida non-albicans</i> | 1 | 0 | 0 |
| <i>Cryptococcus neoformans</i> | 0 | 2 | 0 |
| <i>Pneumocystis sp.</i> | 1 | 2 | 0 |
| Other fungi | 0 | 4 | 0 |